

Congressional Stock Trades & Disclosures
Shelley Moore Capito is a U.S. Senator, a Republican representing WV. As of August 2026, Quantellect has tracked 624 disclosed stock trades across 195 companies, representing $6.3M in disclosed transaction value, each filed publicly under the STOCK Act.
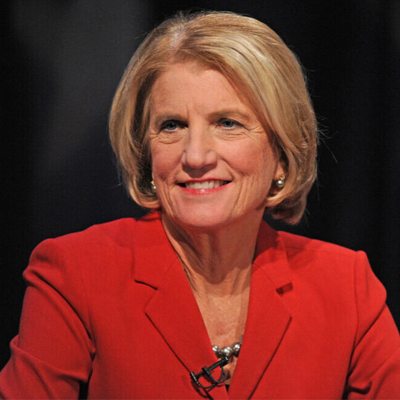
Trading summary
Shelley Moore Capito
- Q Score
- 65Moderate
- Estimated profit results · 2Y
- Q Score rank
- #28 of 77
- Profitability rank · by return %: #29 of 77
- Profit win rate (2Y)
- 75%
- 15 of 20 priced buys up · unrealized
- vs S&P 500 (2Y)
- +1.4%
- +$3K estimated excess profit
- Latest disclosed trade
- Sell · AAPL
- Traded 21 JUL 2026 · Disclosed 04 AUG 2026
About Shelley Moore Capito's congressional trading
The single most striking fact in Shelley Moore Capito's disclosure record is not any one trade but who is doing the trading. Of 624 disclosed transactions dating back to 2012, 545 are attributed to a spouse, only 34 are attributed to the senator herself, three are joint, and 42 carry no attribution code at all. Every transaction detailed in the most recent filings in this record carries the "Spouse" attribution label. This is a household trading record filed under a senator's name, not a personal stock-picking log, and that distinction matters for how the activity should be read.
The record also shows a genuine change in behavior over time rather than a single static pattern, and both periods are documented here. In 2016 through 2018, disclosed activity ran heavily toward purchases: 26 transactions in 2016 (22 purchases against just 2 sales), 94 in 2017 (76 purchases, 14 sales), and a peak of 164 in 2018 (107 purchases, 53 sales). Sales exceeded purchases in 2019 and in every year from 2021 onward, with 2020 the exception. That year produced 70 transactions with only 2 purchases against 65 sales and 3 other transactions. In 2020, purchases slightly exceeded sales, eight to seven. Later years skewed toward selling: 33 transactions in 2022 (4 purchases, 29 sales), 44 in 2023 (10 purchases, 34 sales), 35 in 2024 (8 purchases, 27 sales), and 66 in 2025 (13 purchases, 53 sales). Through the middle of 2026, the record already shows 22 transactions, 5 purchases against 17 sales, continuing the same sell-heavy tilt. Across the full record, sales outnumber purchases 337 to 274.
Recent Activity and What Changed Hands
The most recent filing in the record covers a cluster of five sales executed on the same day, July 21, 2026, and disclosed August 4, 2026: partial sales of Coca-Cola, Cisco Systems, Intel and Apple, plus a larger partial sale of Microsoft in the $15,001-$50,000 range. The five transactions spanned beverages, networking equipment, semiconductors, consumer hardware and software, and each carries the “Spouse” attribution label.
Earlier in 2026, the activity shows some rotation rather than pure liquidation. In February, sales of Illinois Tool Works, Paychex (a full sale), Analog Devices and BlackRock were paired with purchases of Broadcom and Alphabet Class C shares. In March, two separate partial sales of FactSet Research Systems followed by a full sale on March 31, ran alongside new purchases of PNC Financial Services and American Express, and a separate purchase of Mastercard. In 2025, similar pairs appear: a July stretch of sales in PPG Industries, Colgate-Palmolive, General Dynamics, Broadcom, Apple, JPMorgan, Aflac, Microsoft and Chubb ran alongside purchases of Alphabet, Meta Platforms and American Express, and a June round of sales touched UnitedHealth Group, Citigroup, Analog Devices, Microsoft, Exxon Mobil and Wells Fargo (a full sale) in one filing. None of this activity in the record carries a "SELF" attribution code; every transaction described here carries the “Spouse” attribution label and is disclosed under the senator's name because federal ethics law requires reporting of a spouse's transactions, not because the trades are described in the filings as her own decisions.
Sector Concentration and the Most Frequently Disclosed Names
By transaction count, the record concentrates in three areas: Information Technology (116 transactions), Financials (114), and a group of 115 transactions where the underlying company's sector could not be classified in this record ("Unknown"). Health Care (56), Industrials (55), Consumer Staples (46), Consumer Discretionary (40), Energy (30), Utilities (20), Communication Services (17), Materials (9) and Real Estate (6) round out the remaining sector activity.
Microsoft is the single most frequently disclosed name in the record, appearing in 38 transactions (5 purchases, 33 sales) running through July 2026, a software and technology company whose operations include Productivity and Business Processes, Intelligent Cloud, and More Personal Computing. Apple follows with 22 transactions (5 purchases, 17 sales); the company designs and markets smartphones, personal computers, tablets, wearables and related services. Banking names are heavily represented: Citigroup (20 transactions, 1 purchase against 19 sales), Wells Fargo (15, with 2 purchases and 13 sales) and JPMorgan Chase (14, split 8 purchases to 6 sales), alongside recurring activity in BlackRock, Chubb and Aflac. Lowe's appears 12 times in Consumer Discretionary, and semiconductor and IT-infrastructure names, Intel, Broadcom, Cisco and IBM, each show up eight to ten times, underscoring the frequency of technology and financial-services names in the disclosures. Energy activity includes recurring transactions in Exxon Mobil and Chevron, while Health Care activity spreads across Abbott Laboratories, Bristol-Myers Squibb, Johnson & Johnson and UnitedHealth Group.
What is available here are individual purchase, sale and other transaction disclosures, including attribution labels, transaction dates and statutory amount ranges. Capito's record contains transactions dating to 2012 and continuing into 2026, with the activity attributed predominantly to a spouse. The yearly figures show purchase-heavy disclosure activity in 2016 through 2018, a shift toward sales in 2019, a slight purchase majority in 2020, and more sales than purchases in every year from 2021 through the latest transactions in the record.
Disclosure Notes
This Quantellect profile is built from disclosed transaction reports. Transactions are reported in statutory dollar ranges, not exact amounts, and dates reflect the transaction date as filed, which can precede the public disclosure date by weeks. Attribution codes (Self, Spouse, Joint, Dependent Child, or Unknown where the filing does not specify) come directly from the underlying filings and are reproduced as reported; unattributed transactions are not characterized as personal trades. Nothing here should be read as an accusation, an inference of motive, or a claim about who directed a transaction. Source filings are available through the Senate Select Committee on Ethics under disclosure requirements established by the Stop Trading on Congressional Knowledge Act of 2012.
Trading activity
Estimated trading profits
The 2Y view uses the same buy-only, priced trade inputs as the Q Score.
Based on 254 of 323 disclosed buys with pricing coverage.
Feb 21, 2014 to Sep 4, 2026
No priced buy disclosures in this window.
No priced buy disclosures in this window.
Based on 3 of 6 disclosed buys with pricing coverage.
Mar 4, 2026 to Sep 4, 2026
Based on 6 of 9 disclosed buys with pricing coverage.
Sep 4, 2025 to Sep 4, 2026
Based on 20 of 24 disclosed buys with pricing coverage.
Sep 8, 2024 to Sep 8, 2026
Based on 32 of 37 disclosed buys with pricing coverage.
Sep 4, 2023 to Sep 4, 2026
Estimated unrealized profit is based on disclosed buy transactions, estimated trade price, and the latest priced-through date. It does not account for later sales, taxes, commissions, slippage, exact execution price, or full portfolio position size. This is descriptive research, not investment advice, and not an allegation of wrongdoing.
Where the Money Sits
share of disclosed trades · top sectors
Periodic Transaction Report filings
| Company | Type | Size | Traded | Est. price | Change |
|---|---|---|---|---|---|
 AAPLApple Inc. AAPLApple Inc. | Sell | $1,001 - $15,000 | 21 JUL 2026 | $327.74 | -2.37% |
 MSFTMicrosoft Corporation MSFTMicrosoft Corporation | Sell | $15,001 - $50,000 | 21 JUL 2026 | $397.75 | +25.63% |
 INTCIntel Corporation INTCIntel Corporation | Sell | $1,001 - $15,000 | 21 JUL 2026 | $105.45 | -9.15% |
 CSCOCisco Systems Inc CSCOCisco Systems Inc | Sell | $1,001 - $15,000 | 21 JUL 2026 | $112.18 | -2.66% |
 KOThe Coca-Cola Company KOThe Coca-Cola Company | Sell | $1,001 - $15,000 | 21 JUL 2026 | $81.97 | +7.44% |
Citigroup New Inc (C) | Sell | $1,001 - $15,000 | 16 JUN 2026 | — | — |
| AAPLApple Inc. | Sell | $1,001 - $15,000 | 17 APR 2026 | $269.98 | +18.52% |
 CEGConstellation Energy Corp CEGConstellation Energy Corp | Sell | $1,001 - $15,000 | 17 APR 2026 | $295.75 | +1.09% |
 AVGOBroadcom Inc AVGOBroadcom Inc | Sell | $1,001 - $15,000 | 13 APR 2026 | $379.75 | -5.75% |
 FDSFactSet Research Systems Inc FDSFactSet Research Systems Inc | Sell | $1,001 - $15,000 | 31 MAR 2026 | $215.94 | +39.84% |
Congressional trading news
The latest news on congressional stock trading, across all members, will appear here as our newsroom publishes it.
Shelley Moore Capito congressional trading FAQ
Can Shelley Moore Capito legally trade stocks?
Yes. Members of Congress are permitted to buy and sell stocks, but the 2012 STOCK Act requires them to publicly disclose each transaction, generally within 45 days. Quantellect compiles Shelley Moore Capito's disclosures so the public can review them.
Where does Quantellect get Shelley Moore Capito's trading data?
Every trade shown is sourced from official Periodic Transaction Reports filed under the STOCK Act. Amounts are reported as ranges, and estimated prices and post-trade returns are derived from end-of-day market data.
How can I track Shelley Moore Capito's stock trades?
Quantellect tracks every stock trade Shelley Moore Capito discloses under the STOCK Act on this page, including the company, the disclosed amount range, and post-trade performance. New filings appear here as they are reported, generally within 45 days of the trade.
How many stock trades has Shelley Moore Capito disclosed?
Quantellect has tracked 624 disclosed trades by Shelley Moore Capito across 195 companies.
Which stocks does Shelley Moore Capito trade most?
Shelley Moore Capito's most frequently disclosed positions are MSFT (38 disclosed trades), AAPL (22 disclosed trades), C (20 disclosed trades), WFC (15 disclosed trades), JPM (14 disclosed trades), and LOW (12 disclosed trades), followed by INTC, AVGO, CSCO, and IBM. The full list of companies and individual filings is shown on this page.
Which sectors does Shelley Moore Capito invest in?
Technology is the heaviest sector in Shelley Moore Capito's classified disclosures, covering 125 disclosed trades. The full sector breakdown is shown on this page and is derived from the companies behind each disclosed transaction.
What was Shelley Moore Capito's most recent stock disclosure?
Shelley Moore Capito most recently sold Apple Inc. (AAPL) in July 2026, according to public STOCK Act filings tracked by Quantellect.
What is Shelley Moore Capito's Quantellect Score?
Shelley Moore Capito has a Quantellect Score of 65 out of 100 (Moderate). The score ranks members by the estimated unrealized results of their disclosed buys over the last 24 months, weighting estimated total profit, profit versus the S&P 500, and win rate. It is a descriptive research signal, not investment advice or an allegation of unlawful trading.
How much has Shelley Moore Capito made trading stocks?
Quantellect estimates Shelley Moore Capito's disclosed buys show an estimated unrealized profit of $7,592 over the trailing 12 months, based on priced disclosed buy transactions through September 4, 2026. This is an estimate and does not account for later sales, taxes, commissions, slippage, exact execution price, or full portfolio position size. It is descriptive research, not investment advice or an allegation of wrongdoing.
Browse all members of Congress who trade stocksSee which stocks Congress tradesCongressional trading overview
Trades reflect disclosures filed under the STOCK Act and are provided for informational purposes only, not investment advice. Amounts are ranges from official filings; estimated prices and post-trade returns are derived from end-of-day market data and may be revised as filings are amended.